

Hippocampus Gene Expression Atlas
The Hippocampus Gene Expression Atlas (HGEA) integrates gene expression and connectivity to define the multiscale organization of mouse hippocampal networks. The HGEA outlines over 20 genetic domains of the dentate gyrus (DG), CA3, CA2, CA1, and subiculum across the entire hippocampal axis. Using multiple anatomical tract tracers, the HGEA delineates each hippocampal region’s input/output connectivity and provides the most detailed, comprehensive wiring diagram of the mouse hippocampus to date. Our analysis of HGEA connectivity patterns revealed new insight into the multiscale organization of the hippocampus and its connections to larger brain-wide networks implicated in spatial navigation, social, and homeostatic behaviors. To help other scientists use the HGEA, we provide several open access tools including coronal and sagittal hippocampal stereotaxic atlases, 3D HGEA viewer, and interactive hippocampal wiring diagram.
See the 3D HGEA Viewer website Interactive Wiring Diagram Videos
Building HGEA 2.0
A major direction for our lab is to build a human HGEA that can be used together with the mouse HGEA to drive translational research as a “Rosetta Stone”. Although the hippocampus is largely conserved across mammalian evolution, its anatomical morphology and gene expression have diverged. Better understanding these similarities and differences will lead to better translational research studies.
Spatial Transcriptomics
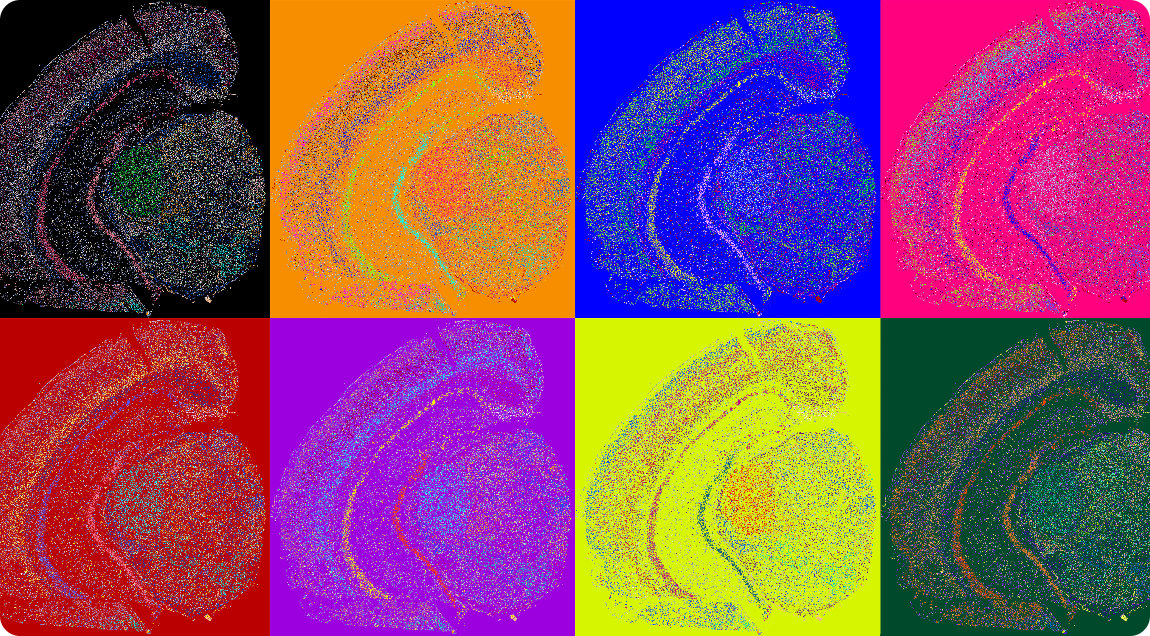
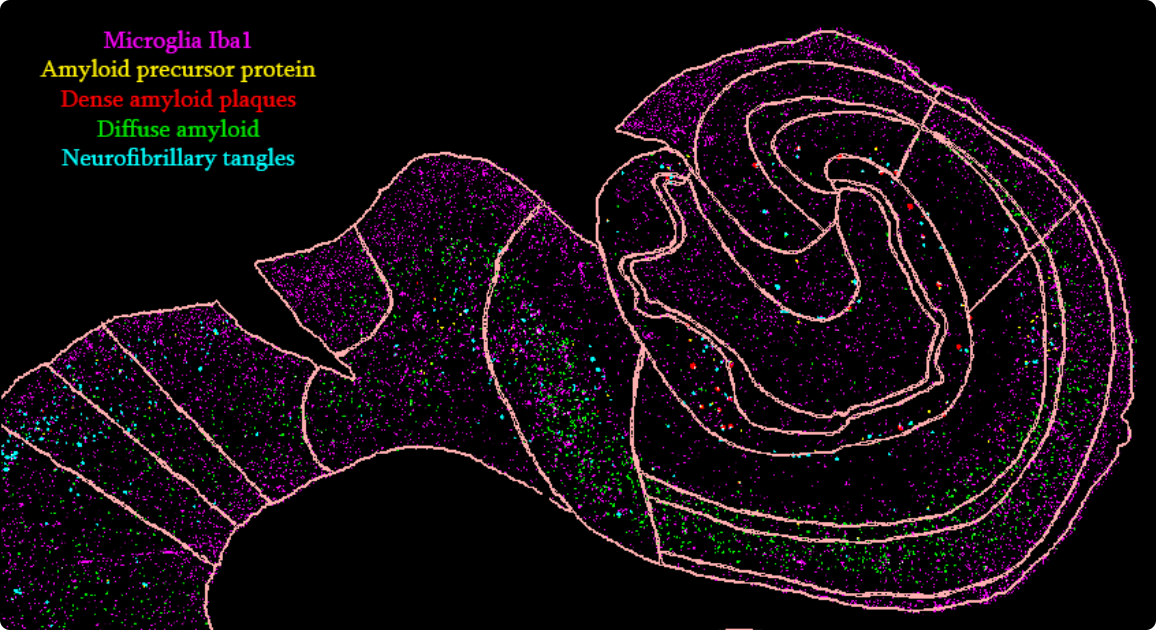
Spatial transcriptomics is a new technology which allows the visualization of gene expression for a thousand genes across the entire brain tissue. The CIC uses MERFISH spatial transcriptomics platform for subcellular imaging of RNA transcripts across hundreds of thousands of cells in brain tissue samples
See all Hippocampus Gene Expression Atlas (HGEA) publications